V Running and Debugging your code
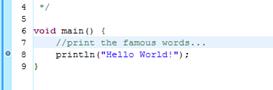
Look at this piece of code:
* Created on 24-Mar-2005
* Author: tt101
*/
void main() {
//print the famous words
println("Hello World!");
}
Its purpose should be quite clear, but of course this isn't worth anything if it is not possible to execute it. So how do we go about that? The first 3 steps apply to both running and debugging.
Make sure you also read the chapter about the Console View, it is quite important for programming using I/O (Input/Output).
-
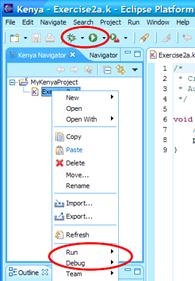
Make sure you are working within the Kenya Perspective
Only the Kenya perspective has the functionality to launch Kenya programs. - Open the code you want to run or select it in the Kenya Explorer
-
You can now use the launch shortcuts in either the toolbar or the right click menu of the selected file in the Explorer:
A further way to launch or debug is the Run menu item, but this is not further explained here, you can find out yourself.
Running
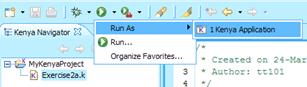
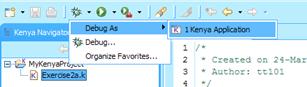
To create a new launch configuration, simply click on the arrow next to the icon (in toolbar) and select Run As -> Kenya Application:
The application will be launched using the external java executable. Note that this can fail if the executable is not on your system PATH. You can try this by opening a command line prompt or shell and typing 'java' (without quotes). KenyaEclipse uses the same java executable.
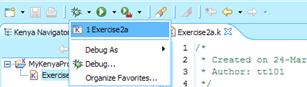
Once you have run an application, you will find a shortcut to run it in the same menu:
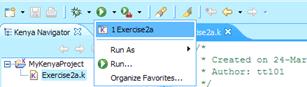
The menu shows the most recent runs with the most recent at the top. Clicking on the icon itself will actually launch the most recent one.
What happens when we run the thing?
You will notice that something happens in the background and that shortly afterwards a new view shows up at the bottom:
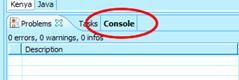
The bold print on the Console tab means that the view contains 'new contents'. In this case they are of course the results of our run:
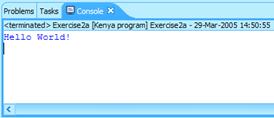
Congratulations, you have run your first application using KenyaEclipse!
Debugging
Debugging allows us to inspect each and every instruction that the program executes, so that we can see where it goes wrong. (Duh, de-bugging)
Make sure you have read the previous chapter on running your code, as it explains some common initial steps.
Debugging is almost exactly the same as running, simply use the arrow next to the bug icon instead:
Since we executed our code earlier, you will find that a shortcut to our program already exists, although it would appear after we first debug as well:
Again, when we run, the Console view will display the output (it looks exactly the same as before).
Breakpoints - what was that about tracing instructions?
To be able to trace, you will first need to create what is called a breakpoint. This is really easy and can be quite powerful. It tells the debugger where to suspend the execution to allow you to inspect the current variables and other things. The way it works in KenyaEclipse is that you simply double click on the Annotation Ruler in the editor, next to the line in which you create the breakpoint. This will create a breakpoint on the left most instruction in the line and place an icon on the ruler so that you know it is there:
- To remove the breakpoint you can double click on it again and it will disappear.
- Right clicking will allow you to disable/enable it temporarily.
- It is of course possible to set finer grained breakpoints. This is done by first selecting the instruction you wish to break on and then double clicking on the ruler.
- To check which instruction is the one used for the breakpoint, you can single click on the breakpoint annotation.
- To change it, just remove the breakpoint and make a different one using the steps above.
The Debug Perspective
Click on debug again, this time, the following window should pop up:
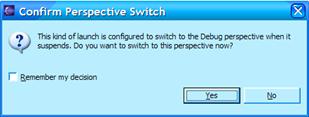
The debugger operates in its own perspective and provides appropriate functionality. To switch to the Debug Perspective, you can click on Yes in the posed dialog.
After confirming the dialog, you will see roughly this picture:
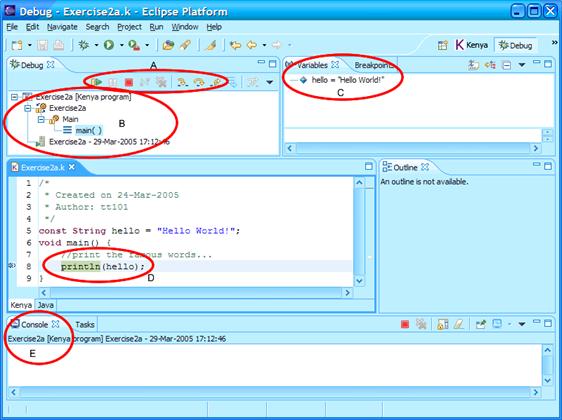
Let me first explain the five components that are highlighted above:
- These tools control the execution of the program. They are in order, resume, suspend, stop, disconnect, clear terminated, step into, step over, step return (and drop to frame). I will soon explain the details for the bold items.
- This view displays the current state of execution down to the method which is currently at the top of the stackframe. If multiple methods are on the stack (one method called the other), then you can click on each one to view its own state of execution in components C and D.
- The variable view allows you to see in detail what variables are declared at the current scope level and watch their values change as you debug your code. The breakpoint view lets you manage your breakpoints for this debug session.
- After clicking on a method in B, this view will jump to the line which is current in that method. In this case you should notice that the execution is supended exactly where we set our breakpoint earlier.
- The console view is back! This view is exactly the same as before and is explained in more detail lateron.
Resume, Stop, Step
These are the main functions used to control execution of the program in debug mode.- Once it has supended (because of a breakpoint you set), you can resume execution by clicking the resume button.
- The stop button will cause the program to terminate forcefully and immediately. You can use this to cancel the whole process.
- Step into is used to execute the next instruction (the one highlighted in D).
- Step over is used to skip the next entire line of instructions (including method calls).
- Step return is used to execute everything up to the end of the selected method.
The Console View
Knowing how to use this view is quite important when working with I/O (Input/Output).
If you are working with I/O, you will have come across the read and print methods that are built into Kenya.
Let's examine the following code:
* Created on 25-Mar-2005
* Author: tt101
*/
void main() {
while(!isEOF()) {
String input = readString();
println("You typed: " + input);
}
}
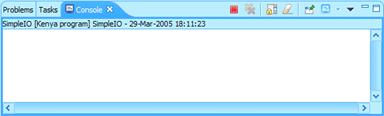
We follow the same steps as above to start execution and following will happen:
The program waiting for input:
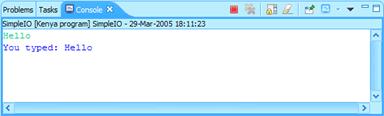
After typing 'Hello' and then pressing Enter:
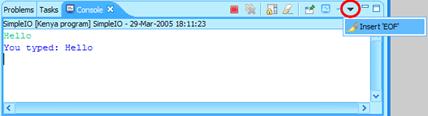
We can of course type things forever, but at some point we need to end the input using EOF (End Of File) so that the program terminates.
Click the downward pointing arrow:
Because of the loop testing for isEOF(), the program is now able to terminate:
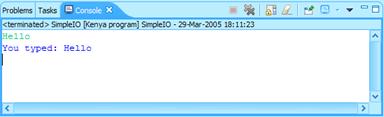
- Input appears in green colour
- Output appears in blue colour
- Errors appear in red colour (hopefully that never happens of course)
- EOF can be achieved by using the console menu
- The console can terminate the program by using the red stop button
Changing launch settings and specifying arguments
If we go back to the beginning, where we launched our program using the launch shortcuts Try using the run (or debug) menu item instead:
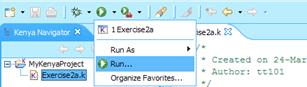
You will be presented with the Launch Configuration Dialog:
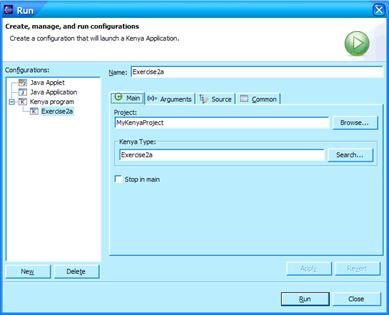
It is best if you explore this dialog yourself. Two options are of particular interest, the first one being the Arguments tab, the second one being the Stop in main checkbox on the Main tab.
You can supply runtime arguments to your program by using the Arguments tab. Arguments are separated by any amount of whitespace, but you can use double quotes to enter arguments that contain spaces.
The Stop in main option is only relevant when you debug your program. If the box is checked, the debugger will automatically suspend upon entering the main method, regardless whether breakpoints are set or not.