Lecture 18: Matching Relational Structures
At the root of many problems in vision is the concept of matching. At the iconic level, matching in the simplest form is finding the maximum of the correlation between a template and an image. In the line extraction phase, it is the problem of establishing the best fit line for the given edge points, and in the subject of stereo, it is the identification of corresponding points through features such as vertices or values of interest operators. In many cases, the matching problem can be constrained, for example by using epipolar lines, to reduce the search time and improve accuracy.
Matching can be made at the purely geometric level. In two dimensions we looked at matching moments between objects in a data base and features extracted from an object. The same procedures can be extended to three dimensional geometric matching, where we might expect there to be significant features such as the distance between vertices, and the angle between adjacent surface normal vectors. In cases where tomographic scanning is used, complete three dimensional data is available, however, for applications where single or multiple cameras are used, such as factory recognition systems, robot vision or autonomous vehicle navigation, the complete three dimensional data is rarely available since parts of the objects are occluded. This is an unfortunate mismatch, since tomographic scans are normally used in medical imaging where simple geometric models are inappropriate. Thus research on three dimensional geometric matching is primarily concerned with resolving uncertain and incomplete data.
The same problem occurs at a higher level when we are trying to match relational structures extracted from an image to a stored structure defining a class of objects. Clearly there are many technical problems to be solved before practical vision systems are going to use this type of algorithm. We saw in the previous lecture the difficulties of formally defining a semantic net for a bicycle, though we noted that it is perfectly possible to write a reliable program to identify the location of bicycles in a picture. Now we are looking at the problem of choosing between a number of possible alternatives. The problem is solvable for small numbers of dissimilar objects, for example to identify and separate lorries, cars and bicycles. However, for similar objects, such as bicycles, motor bikes and tricycles the problem becomes rapidly harder.
Graph Isomorphism
The underlying mathematical problem in matching is to identify graph isomorphism. We extract a relational structure in the form of a semantic net from the image, and we compare it with a number of stored graphs in order to find the best match. Alternatively we may extract a group of geometric features and wish to find a set in the data base of which they are a unique subset. The problem is that due to the difficulties in low level vision, the extracted net will be inaccurate in some respects, so exact matches will not be found. Matching can be carried out using simply the topology of the graph, eg:
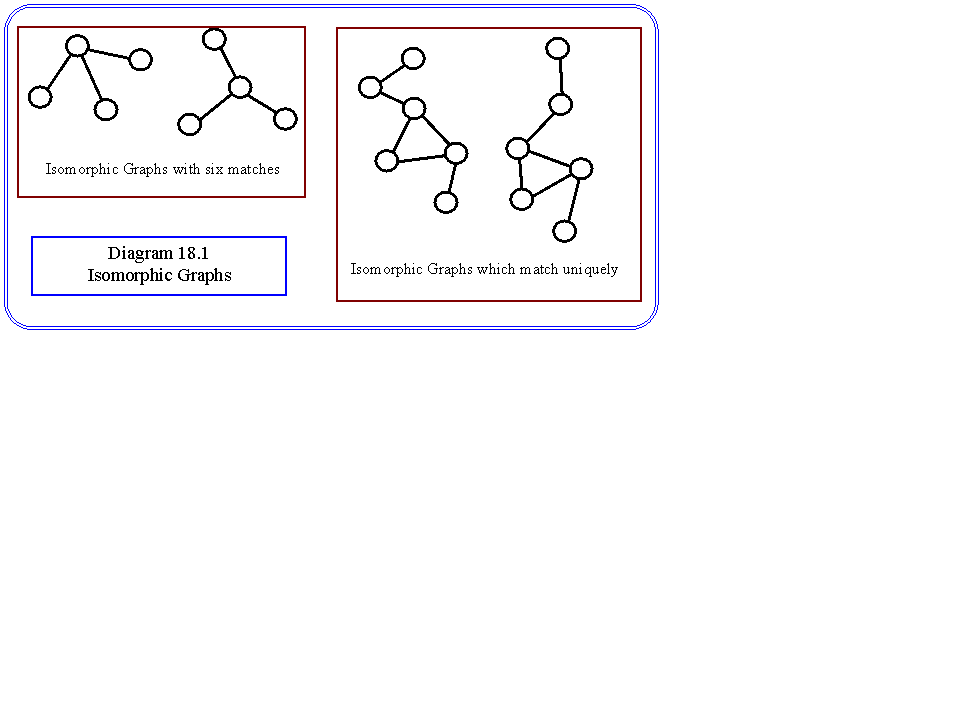
Graph Isomorphisms: In two graphs there is a 1-1 mapping between the vertices and the arcs connecting the vertices. There may not be an unique match between graphs. Diagram 18.1 shows some isomorphic graphs.
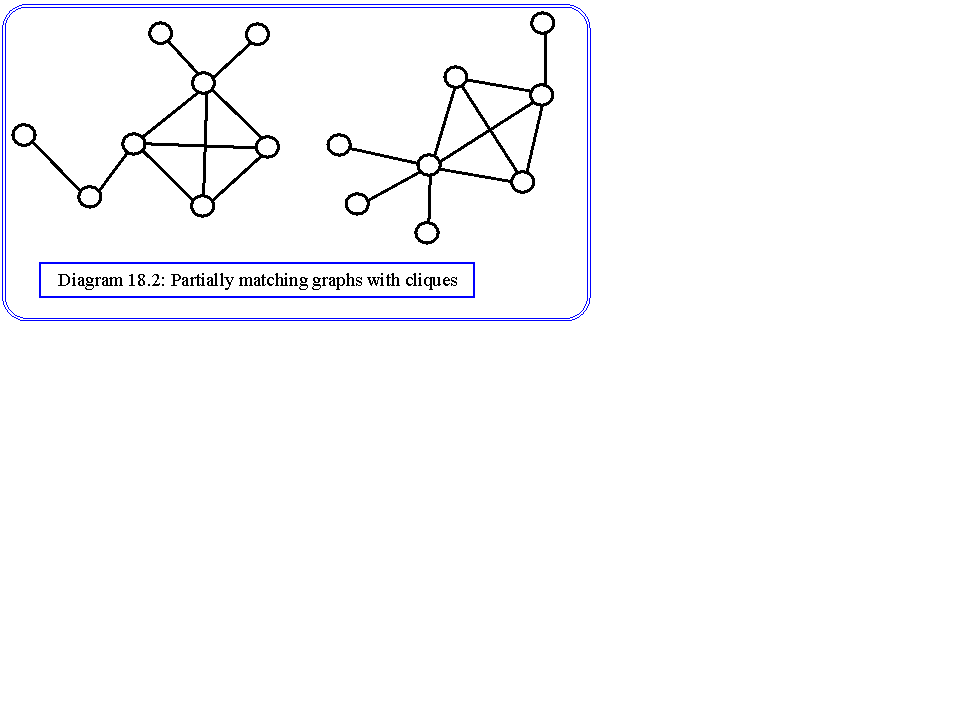
Subgraph Isomorphism: One graph may be isomorphic to a subgraph of a stored relational structure, or more generally a subgraph of the extracted graph may be isomorphic to a subgraph of a stored graph. The search time for isomorphic subgraphs is considerably longer than the search for isomorphic graphs. Graphs with matching subgraphs are sometimes termed partial isomorphs, or partial matches. Some examples are shown in diagram 18.2.
Clique Algorithm
Searching for exact matches is done in two stages, the first is to find cliques. A clique is a totally connected subgraph of a graph. There are many algorithms for finding cliques, the simplest being to grow them from single nodes. For each node in turn, we know that the nodes connected to it form a clique of size two. We can check the neighbours of each pair to find cliques of size three, and so on until the maximal cliques are found. These now are used as candidates for matching.
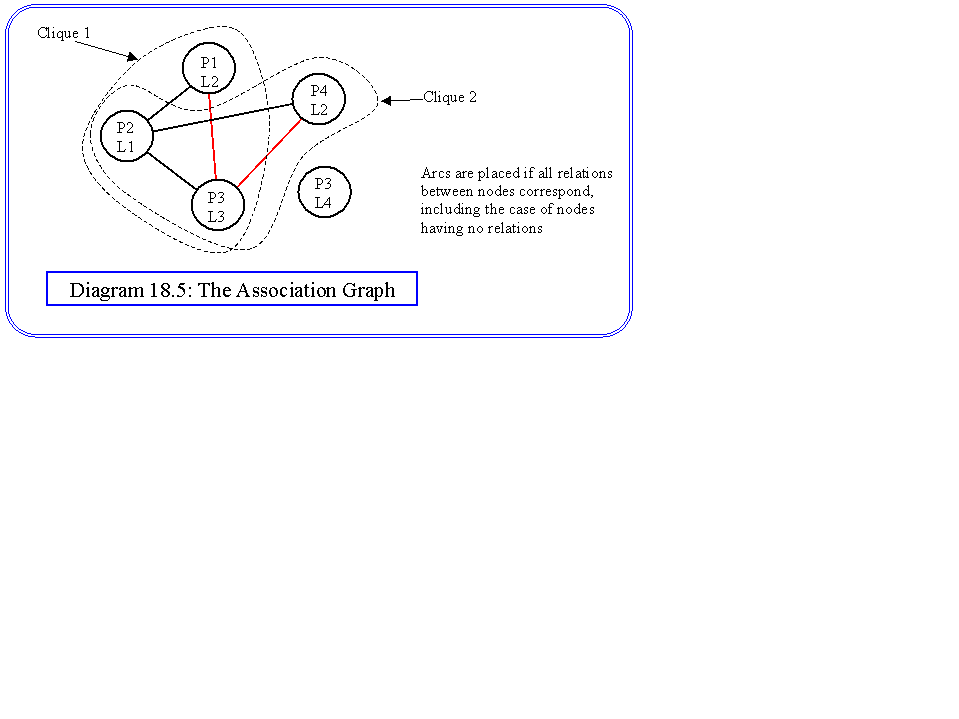
Another way in which cliques can be used is in constructing an association graph. This is simply a graph in which each node is a matched pair between the extracted semantic net and the stored nets. In general these pairs will have matched properties, so for the bicycle we will only consider matching nodes representing circles with nodes representing circles in the data base. The arcs are then used to denote compatability between the nodes that they join. Two nodes are compatible if all relations that apply to one apply to the other. Hence, if the nodes are {P1,L1} and {P2,L2} where the vertices of the graphs are labelled by P and L, then the nodes are taken as compatible unless there is a relation r which is true for P1,P2 but not for L1,L2.
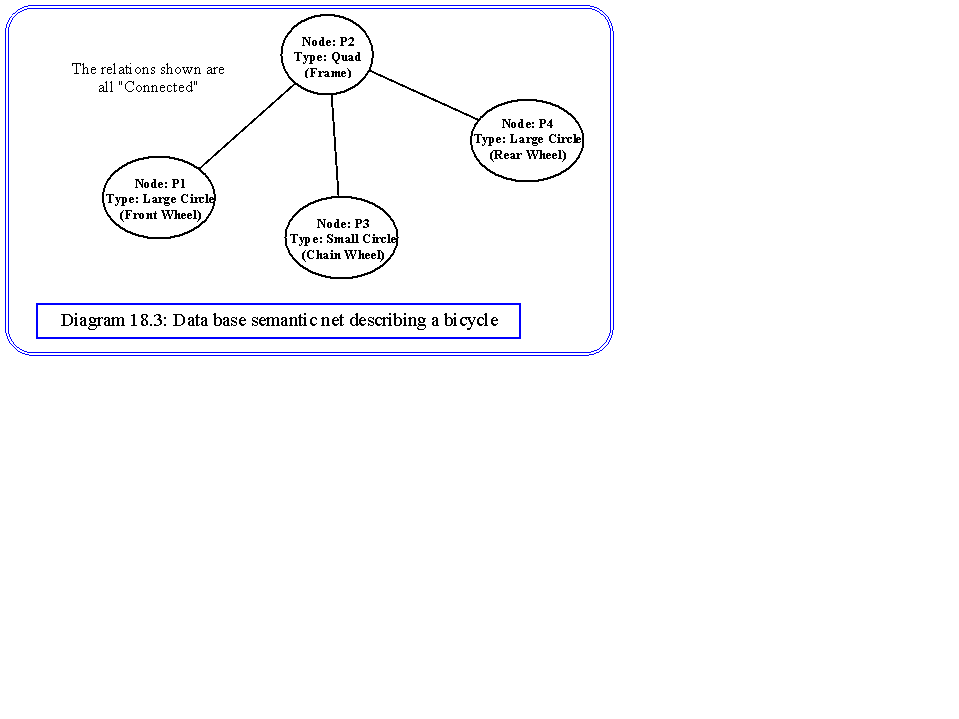
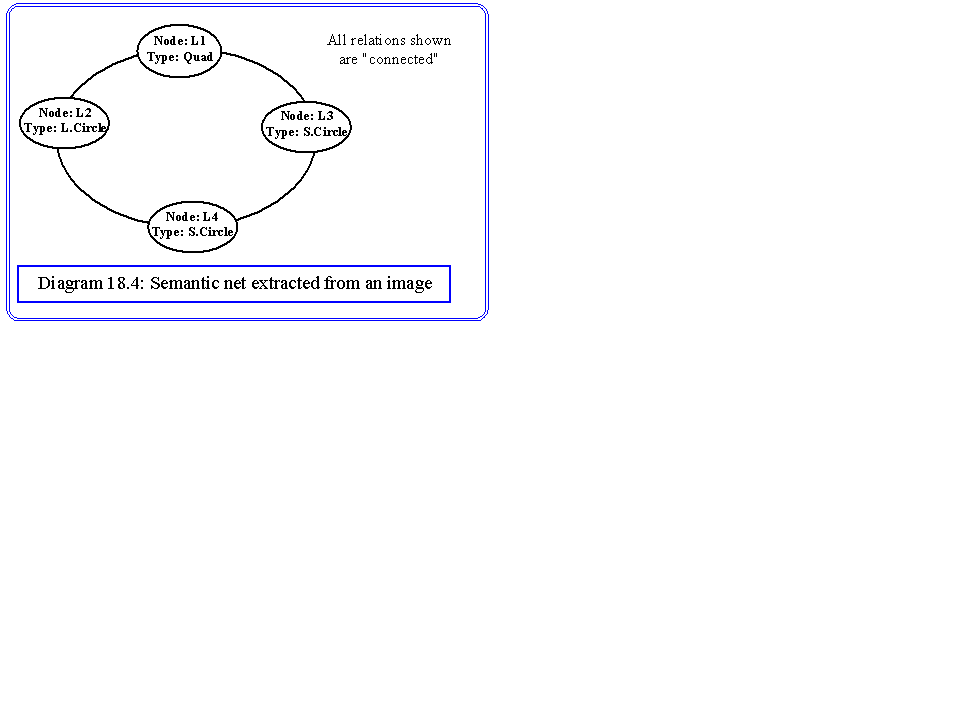
Once this graph has been constructed, we simply look for the largest clique, which is the best match sub-graph. An example will make this algorithm clear. Diagram 18.3 shows a very simplified semantic net describing our bicycle. There is only one type of relation - connected - and three types of objects - small circle, large circle and quadrilateral - representing the chain wheel, wheels and frame respectively. In practice, our extraction system may suggest a net of the form shown in diagram 18.4. This may represent a bicycle where the rear wheel has not been identified, and a second small circle has been found and connected to the chain wheel. This could be caused by the background or foreground components of the scene, or possibly because the candidate net does not represent a bicycle. Diagram 18.5 is the association graph. There are only five possible node pairs when the types are taken into consideration, one for the two quadrilaterals, and two among the small circles and two among the large circles. The connected relation allows us to put in the compatibility arcs, which identifies two possible three node cliques, representing the best match for that candidate structure. One matches the large wheel found in the image, with the front wheel. The other matches it to the rear wheel. One of the small wheels cannot match with anything and is an isolated node in the association graph.
Matching Metrics
We noted that the candidate structure of diagram 18.4 may or may not be a bicycle. Having established the fact that a match can be found, we can consider how much evidence that gives us for making the assertion that the candidate structure is indeed a bicycle. For an exact match we can make the deduction easily, however, in practical cases we will not have an exact match. There will be both missing elements, missing relations, and there will possibly be nodes where the types do not fully match. For example, we introduced the types 'small circle' and 'large circle'. There are clearly degrees to which entities can match these types. Matching metrics are ways of computing a cost from these disparities.
Unfortunately, the way in which these costs are arrived at is through prior knowledge. We may, for example wish to express the fact that the presence of the rear wheel in a bicycle is very important, since it is always visible in practical cases. Conversely, the recognition of the chain wheel may be less important, since in many cases it may be obscured by for example the chain guard, or by the frame itself. Methods of this kind tend to be ad hoc, and , in any general purpose system, the only possible metrics are based on point to point matching.
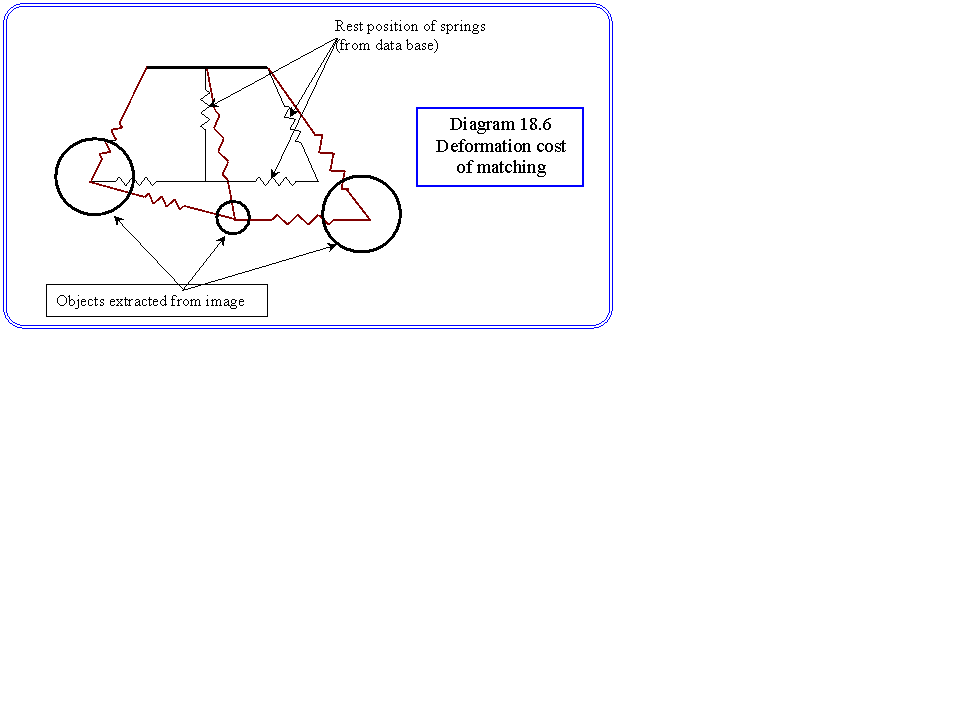
In general we could measure the quality of our match in three parts. The first is a cost associated with the missing parts of the stored object model. The second is a template cost which measures how well the components fit the model, for example whether the radius of the extracted circle corresponds well to the radius of bicycle wheel. The third is a geometric cost, which we can express as the degree to which we need to deform our stored (data base) model to fit the data. This last quantity is sometimes calculated as spring energy. The idea is illustrated in diagram 18.6. Here each geometric point is connected by a spring. When the corresponding points are found from the image, the total energy required to displace the springs to the corresponding positions can be used as a metric.