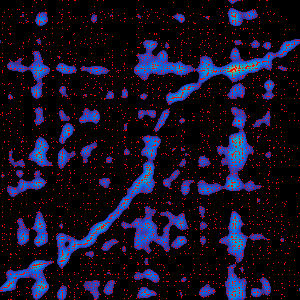
The interactive tool above is an adjacency matrix visualization of the Bitcoin blockchain to block 425,000.
The image is served from a tile server and can be zoomed and panned in the same manner as you would use Google Maps.
It shows the flows of amounts of bitcoin between blocks of the blockchain.
The source block of an amount of bitcoin transacted is represented along the x-axis.
The destination block for the amount is represented up the y-axis.
The flow between blocks is coloured with a blue to yellow heatmap according to its percentage contribution to the destination block.
Sounds complicated?
Right, but now, for the first time, we can have a holistic view of transactions in the blockchain.
In this way for example, one can see the first ever transaction in the bottom left of the visualization:
In block 170, Satoshi famously sent BTC10 to Hal Finney from the BTC50 coinbase reward originally mined in block 9.
It is coloured bright yellow since the transaction represents 100% of the inputs into block 170.
You can also see the next transaction occurred in block 181, 100% of which came from that block 170.
Obviously inputs to block 170 can only have come from the previous 170 blocks, whereas there are 425,00 potential origins of amounts at the top of our visualization, hence its triangular shape.
What else can we see?
Firstly note the high heat intensity along the diagonal. This shows that of the bitcoins transacted, most have been transacted very recently: high churn.
Also note in the early period a strong linear feature trailing the main diagonal. This represents the 100 block lockup period until coinbase rewards are allowed to be spent.
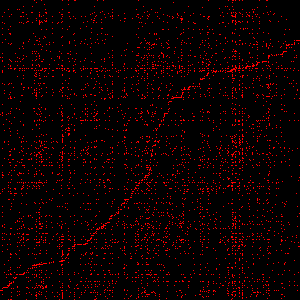
It is also not difficult to notice other anomalous horizontal, vertical and diagonal linear features.
A horizontal feature represents one or more transactions in a single block that have inputs from many different blocks - a consolidation.
A vertical feature represents many transactions over many blocks spending many outputs from transaction(s) in a single block - a distribution.
A continuous diagonal feature shows bitcoins of a constant age being spent.
Anything else?
We can also see other anomalies, such as during the destination period from around block 381600 to 412000, which spent incremental amounts from source blocks 323430 to 327000. Such pattern repeating during the period 422000-424600.
Or the long 1yr period from 374000 to 425000 which saw very regular spending of amounts from the 12day period 367100 to 368800.
Many more interesting anomalous behaviours can be observed in the visualization.
Why?
We are now refining our algorithmic tools to automatically detect and cluster these anomalous patterns of transactional behaviour, applicable across multiple public blockchains. Using the sole knowledge that a transaction has occurred, we can infer patterns of anonymous transactional association with high levels of confidence:
 ->
->