in between two AQP0 tetramers, which is not typically the
case for lipids surrounding membrane proteins in biological
membranes.
The tight positioning of the lipids in AQP0 crystals reduced
their mobility and rendered them visible in the density maps,
making it possible to describe the lipidprotein interactions.
If AQP0 2D crystals could be grown with other lipids, such
crystals would provide an opportunity to study how a mem-
brane protein interacts with different lipids in a near-native
environment. While formation of high-quality 2D crystals
usually requires the use of a specific lipid, aquaporins can
often form 2D crystals with a variety of lipids. AQP1, for
example, formed large, well-ordered 2D crystals with three
showed that, in addition to DMPC, AQP0 also forms 2D
crystals with E. coli polar lipids (EPLs). E. coli polar lipids
differ from DMPC in headgroup chemistry, as well as acyl
chain length and saturation. The headgroups of EPLs are a
mixture of phosphatidylethanolamine (PE), phosphatidylgly-
cerol (PG) and cardiolipin (CL) rather than the pure phos-
phatidylcholine (PC) headgroup of DMPC. The acyl chains of
DMPC are two saturated 14-carbon acyl chains, whereas the
average length of the acyl chains of EPLs is 16 carbon atoms,
and approximately 55% of the acyl chains are unsaturated
quality of the AQP0 2D crystals formed with EPLs and
produced a density map at 2.5 A
° resolution. As with the
previous density map produced with 2D crystals formed
with DMPC, the current density map revealed the seven
annular lipids, allowing us to compare the interactions of
AQP0 with two very different lipids, DMPC and EPLs.
Results
Structure of AQP0 in DMPC and EPL bilayers
Well-ordered, double-layered 2D crystals of AQP0 formed
with EPLs at a lipid-to-protein ratio of 0.25 (mg/mg;
Figure 1A). These crystals were used to record electron
diffraction patterns at liquid helium temperature (
B6 K).
Diffraction patterns from untilted crystals showed reflections
beyond 1.9 A
° (Supplementary Figure S1), but the resolution
was more limited in diffraction patterns of highly tilted
crystals (Supplementary Figure S2). After merging 281 dif-
fraction patterns and phasing by molecular replacement, we
produced a density map at 2.5 A
modelled and refined the structure of AQP0 (residues 7226)
and 227263, which include the C-terminal helix modelled in
the previous structure of AQP0 in a DMPC bilayer (Gonen
therefore excluded from the model of AQP0 in the EPL
bilayer.
Other than the C-terminal helix, which was disordered and
therefore could not be modelled, the structure of AQP0 in the
EPL bilayer (AQP0EPL) is virtually identical with its structure
in the DMPC bilayer (AQP0DMPC; Figure 1D). The r.m.s.d.
values between all modelled backbone atoms is 0.48 A
° ,
and 0.4 A
° if only the transmembrane domains are compared.
The pore-lining residues in AQP0EPL and AQP0DMPC are also
essentially the same, and both structures show three water
molecules in the centre of the channel at the same positions
Modelling the EPL bilayer
In addition to the protein, the density map also allowed us to
build all seven annular lipids surrounding each AQP0 mono-
mer, but not the lipids in the central area between four
adjacent tetramers (asterisks in Figure 2A). The acyl chains
of the annular lipids were initially modelled as 10 carbon
chains and then extended to occupy the maximal length that
was clearly resolved in the density map. In the initial density
map, densities representing the acyl chains were often
branched, indicating that they can adopt multiple conforma-
tions. As the data were insufficient for the refinement of
alternative conformations, we chose to build each acyl chain
into the strongest density, representing the predominant
lipid conformation. After several rounds of refinement, the
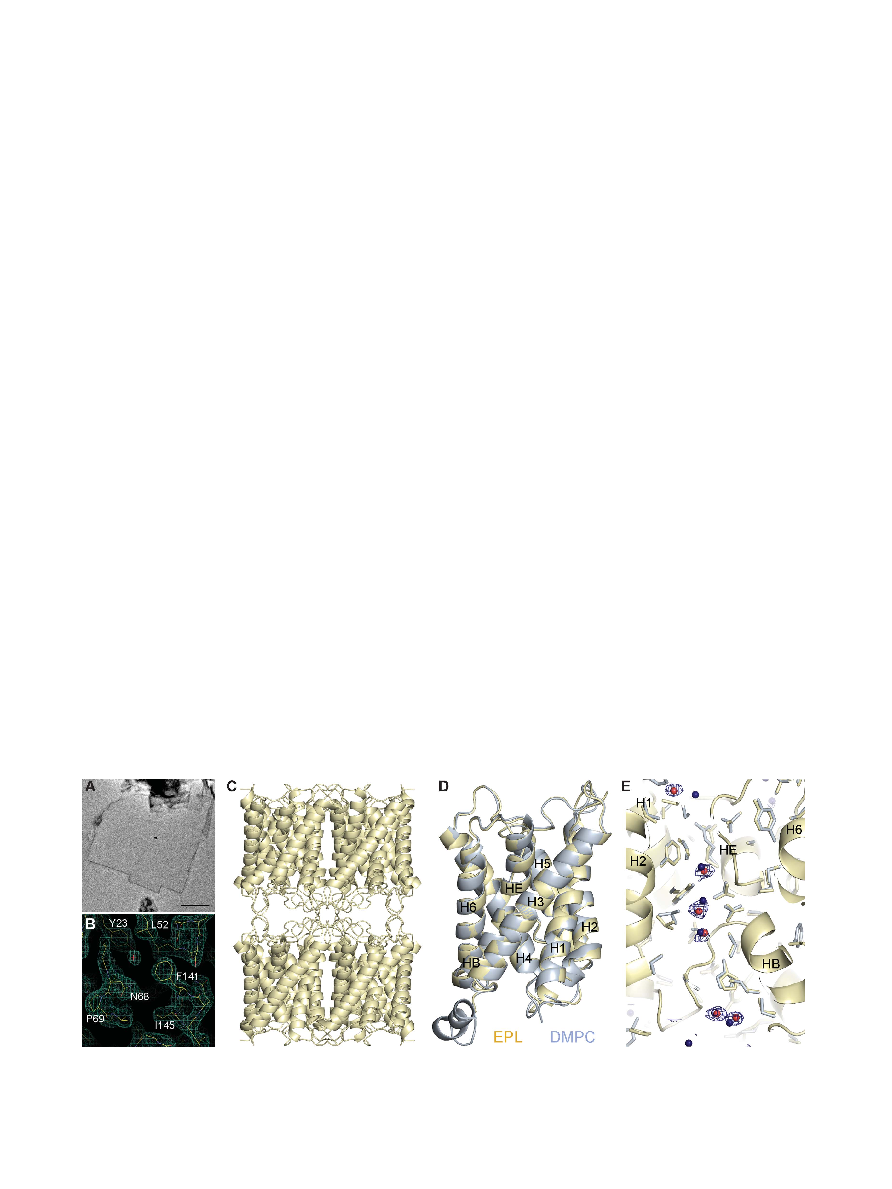
Figure 1 Double-layered 2D crystals of AQP0 in Escherichia coli polar lipids (EPLs). (A) Representative AQP0 2D crystal formed with EPLs in
negative stain. Scale bar: 1 mm. (B) Region of the final 2FoFc map refined to 2.5 A
° resolution showing pore-lining residues and a water
molecule. (C) Atomic model of the AQP0 membrane junction. (D) Overlay of the AQP0EPL (gold) and AQP0DMPC (light blue) structures. (E)The
water pore in AQP0EPL (gold) and AQP0DMPC (light blue). The three water molecules in the pore of AQP0EPL (red) are at similar positions as those
previously seen in AQP0DMPC (blue). The 2FoFc density map for the water molecules is shown at a contouring level of 1s (blue wire mesh).
Interaction of AQPO with E. coli lipids
RK Hite et al
&
2010 European Molecular Biology Organization
The EMBO Journal
VOL 29 | NO 10 | 2010 1653