branches disappeared, and all acyl chains were represented
by a single, mostly continuous density.
Approximately 55% of the acyl chains of EPLs contain an
unsaturated bond, with the two most abundant species being
some lipids showed kinks that could indicate the presence of
a double bond, due to the heterogeneity of the acyl chains in
EPLs, we modelled all acyl chains as being fully saturated.
Escherichia coli polar lipids are a mixture of three different
(2007)) with PE being by far the most abundant headgroup.
We therefore initially modelled all headgroups as PE. After
refinement, we found no evidence in the density map, which
suggested that any of the lipid positions is preferentially
occupied by a lipid with a particular headgroup. Our final
model of the EPL bilayer thus contains seven PE molecules
with saturated acyl chains ranging from 5 to 17 carbon atoms
Organization of the EPL and DMPC bilayers surrounding
AQP0
The EPL and DMPC bilayers surrounding AQP0 are remark-
same number of lipids at comparable positions (Figure 3C)
and have almost the same thickness (the average distance
between the phosphodiester groups in the two leaflets is
31.9 A
° for the EPL bilayer and 33.6 A° for the DMPC bilayer;
Figure 3A). As acyl chains of EPLs are on average longer than
those of DMPC (16 versus 14 carbon atoms), this finding
raises the question how the longer EPL acyl chains are
accommodated. Unexpectedly, despite the longer acyl chains
of EPLs, the average distance between the C2 atoms of
glycerols in the two leaflets of the EPL bilayer, 27.0 A
° ,is
smaller than the corresponding average distance in the
DMPC bilayer, 31.2 A
the AQP0EPL and AQP0DMPC structures reveals that the
DMPC molecules cover less surface area on AQP0 than EPLs
the hydrophobic surface of AQP0 uncovered (Figure 2C, e.g.
area in between PC3 and PC4 of the extracellular leaflet and
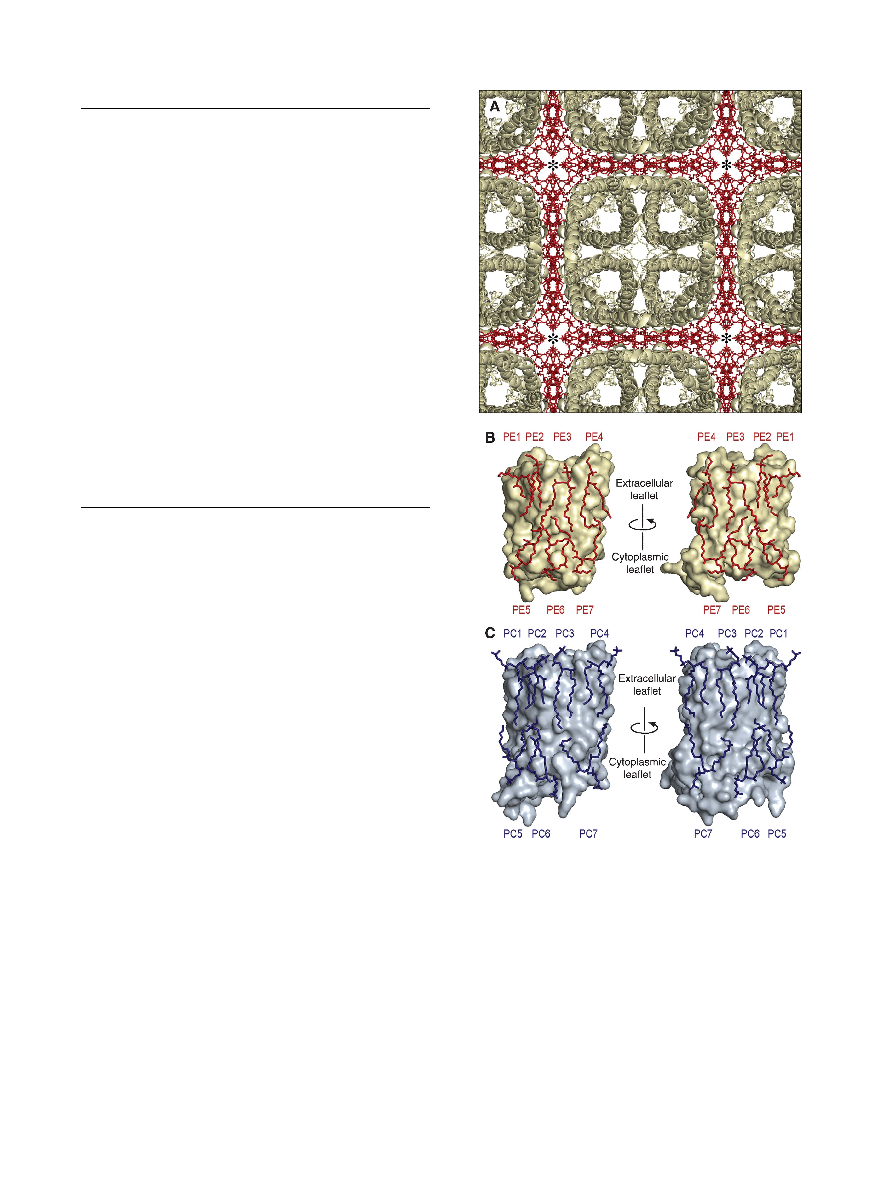
Figure 2 The EPL bilayer. (A) Top view of the AQP0 2D crystal
showing AQP0 tetramers (gold) and the surrounding EPLs (red). (B,
C) The seven (B) annular EPLs and (C) DMPC molecules surround-
ing an AQP0 monomer. As lipids are sandwiched between two
adjacent AQP0 subunits, their positions relative to both AQP0
subunits are shown.
Table I Electron crystallographic data
Two-dimensional crystals
Layer group
p422
Unit cell
a ¼ b ¼ 65.5 A
°
Thickness (assumed)
200 A
°
Electron diffraction
Number of patterns merged
281 (01: 11; 201: 22;
451: 63; 601: 108; 701: 77)
Resolution limit for merging
2.3 A
°
RFriedel
18.9%
RMerge
22.6%
Observed amplitudes to 2.5 A
°
129 893
Unique reflections
14 417
Maximum tilt angle
74.21
Fourier space sampled
92.3% (83.5% at 2.62.5 A
° )
Multiplicity
8.1 (4.0 at 2.62.5 A
° )
Crystallographic refinement (10.02.5 A°)
Resolution limit for refinement
2.5 A
°
Crystallographic R factor
24.98%
Free R factor
28.43%
Reflections in working/test set
12 801/1453
Non-hydrogen protein atoms
1668
Non-hydrogen lipid atoms
273
Solvent molecules
8
Average protein B factor (A
° 2)
42.3
Average lipid B factor (A
° 2)
88.0
Ramachandran plot (%)
98.4/1.6/0.0 (allowed;
generous; disallowed)
Rfree is calculated from a randomly chosen 10% of reflections, and
Rcryst is calculated over the remaining 90% of reflections.
Interaction of AQPO with E. coli lipids
RK Hite et al
The EMBO Journal
VOL 29 | NO 10 | 2010
&
2010 European Molecular Biology Organization
1654