How to generate plots using unit tests in Python?
When I work with datasets, I often want to do two things: test the dataset to make sure its okay and visualise descriptive properties like samples and sizes. But I want this process to be robust and reproducible. Unlike Jupyter notebooks, I want a modular experience rather than shoving random pieces of unchecked code in cells. To be picky, I also want this analysis or report to be easily sharable on the internet.
Unit report is a simple small Python library that leverages the unit testing framework to do exactly the two things I want. Here is a code example of what it actually looks like:
import unittest
import unitreport
# Unit report builds on unittest library
import seaborn as sns
import pandas as pd
# You can use any data processing library
class TestExample(unittest.TestCase):
"""Example test suite producing plots and tables in a report using unitreport."""
dataset: pd.DataFrame = None
@classmethod
def setUpClass(cls):
"""Load dataset on setup."""
cls.dataset = sns.load_dataset("fmri")
@unitreport.plotting
def test_timepoint_vs_signal_by_event(self):
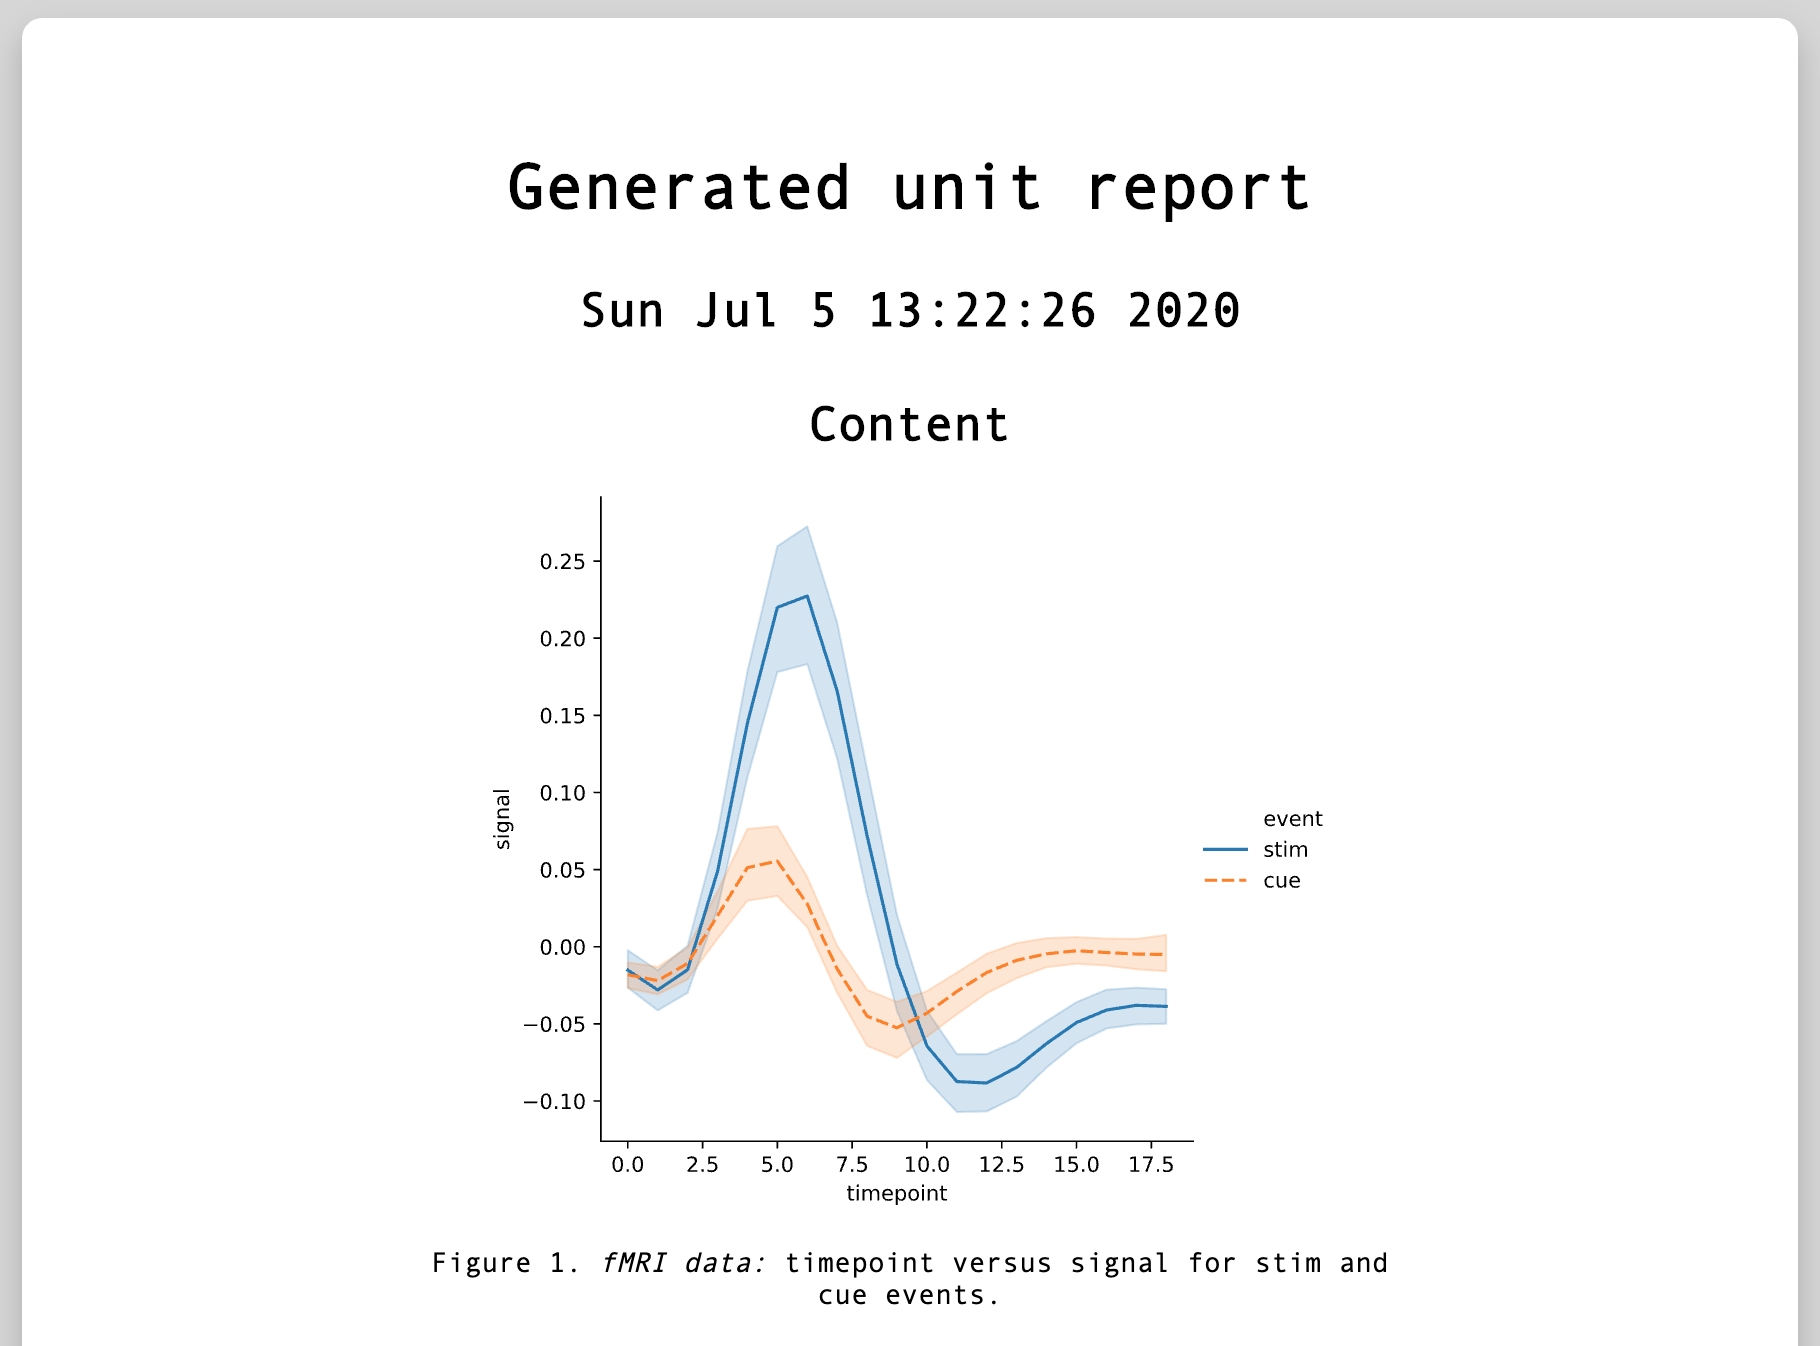
"""*fMRI data:* timepoint versus signal for stim and cue events."""
# you can still run assertions to check data quality before plotting
self.assertEqual(self.dataset.shape, (1064, 5))
# plotting decorator will call plt.savefig() to generate the plot
sns.relplot(
x="timepoint",
y="signal",
hue="event",
style="event",
kind="line",
data=self.dataset,
)
# could also return a figure & .savefig() will be called on returned object
@unitreport.tabling
def test_region_counts(self):
"""*fMRI data:* table summary description of timepoints and signals."""
# you can still run assertions to check data quality before making table
self.assertEqual(self.dataset.shape, (1064, 5))
return self.dataset.describe().to_html()
which is rather familiar for existing customers of the Python unit testing framework. You basically setup unit tests that can:
- Assert things about the dataset as usual. For example, are all the examples of a certain shape? Is there a minimum number of examples? Are the labels within a certain range? The usual checks one must do in the realm of machine learning.
- Create unit tests that generate matplotlib plots and accumulate them into a neat, self-containted HTML file. This is great for plotting descriptive statistics of your data as well as visualising samples. What does an image in the dataset look like? How many labels are there? You can also assert properties about the data before plotting in the same unit test allowing you to ensure your plotting functions will work since if an assertion fails, unit test stops the execution of that test case.
- Create tables that show aggregate data. These are again accumulated and placed into the HTML report file. You can in general just return any HTML output to be included in the report for extra flexibility. This means if the unit test successfully runs it will show up in the report.
The result is a self-contained HTML report with all your output plots and tables that you can easily share. The above code when run using python3 -m unitreport which discovers and executes the test suites, just like unit test does, gives the following report with the first plot corresponding to test_timepoint_vs_signal_by_event:
unitreport
that is effectively just the list of the generated plots and tables. You might wonder why this is all useful. By having a robust testing suite against a dataset, or anything really, you can rerun the same tests and analysis on different datasets which helps with reproducibility and consistency. Is your training data distribution very different to the test one? Well, instead of fiddling with a Jupyter notebook, you can write a set of unit tests and run unit report on both the datasets! Then you can get a clear, reproducible, self-contained report for both. Is the new data you got different, how so? Just rerun your testing suite to see if any tests fail, if not check the generated report!
I really like how it integrates well with the unittest library and only uses decorators to capture the plots and the tables. Everything else is left as is. This also means that the unit tests, including the plotting ones, are still isolated and follow the same principles of unit tests. You are encouraged to give meaningful names to your plots and descriptions. The library itself is small and open for extensions if you need to customise it. For example, you might want to use a different plotting library or create a specific unit test that outputs text to the report if it is successful. You can also customise the template and the style but honestly what I like about this library is that it provides a nice starting point for what could be a very useful, highly customisable tool.