How to Setup Grafana and Prometheus with Docker Compose?
Grafana and Prometheus are two popular tools for monitoring infrastructure. They work together really well and produce really nice visuals. We’ll aim for a minimal setup so you can get started quickly and expand as you need. We’ll create the following components:
- Grafana: A tool to create dashboards and visualise data. It doesn’t by itself collect data but can connect to various data sources.
- Prometheus: A monitoring tool that collects metrics from various sources. It can be used to monitor servers, containers, and other services.
- A prometheus.yml file: This file will define the targets that Prometheus will scrape for metrics.
In a single directory called monitoring, let’s first create the compose.yaml file:
# compose.yaml
services:
  grafana:
    image: grafana/grafana:latest
    restart: unless-stopped
    volumes:
      - grafana_data:/var/lib/grafana
    ports:
      - 3000:3000
    environment:
      - GF_SERVER_ROOT_URL=http://example.com # Change this to your domain if accessing from outside
    deploy:
      resources:
        limits:
          cpus: '0.5'
          memory: 1gb

  prometheus:
    image: prom/prometheus:latest
    restart: unless-stopped
    volumes:
      - ./prometheus.yml:/etc/prometheus/prometheus.yml
      - prometheus_data:/prometheus
    deploy:
      resources:
        limits:
          cpus: '0.5'
          memory: 1gb

volumes:
  grafana_data:
  prometheus_data:
Note that we are not exposing Prometheus to the outside world. We’ll use Grafana to access Prometheus. We’ll also create a prometheus.yml file in the same directory:
global:
  scrape_interval: 15s

scrape_configs:
  # This is telling prometheus to scrape itself
  - job_name: prometheus
    static_configs:
      - targets: ['localhost:9090']
  # Add more jobs here
Now, let’s start the services:
docker-compose up -d
And that’s it! You can now access Grafana at http://localhost:3000, you need to:
- Login with the default credentials:
adminandadmin. - Change the admin password.
- Add Prometheus as a data source. Use
http://prometheus:9090as the URL. - Create a dashboard and add panels.
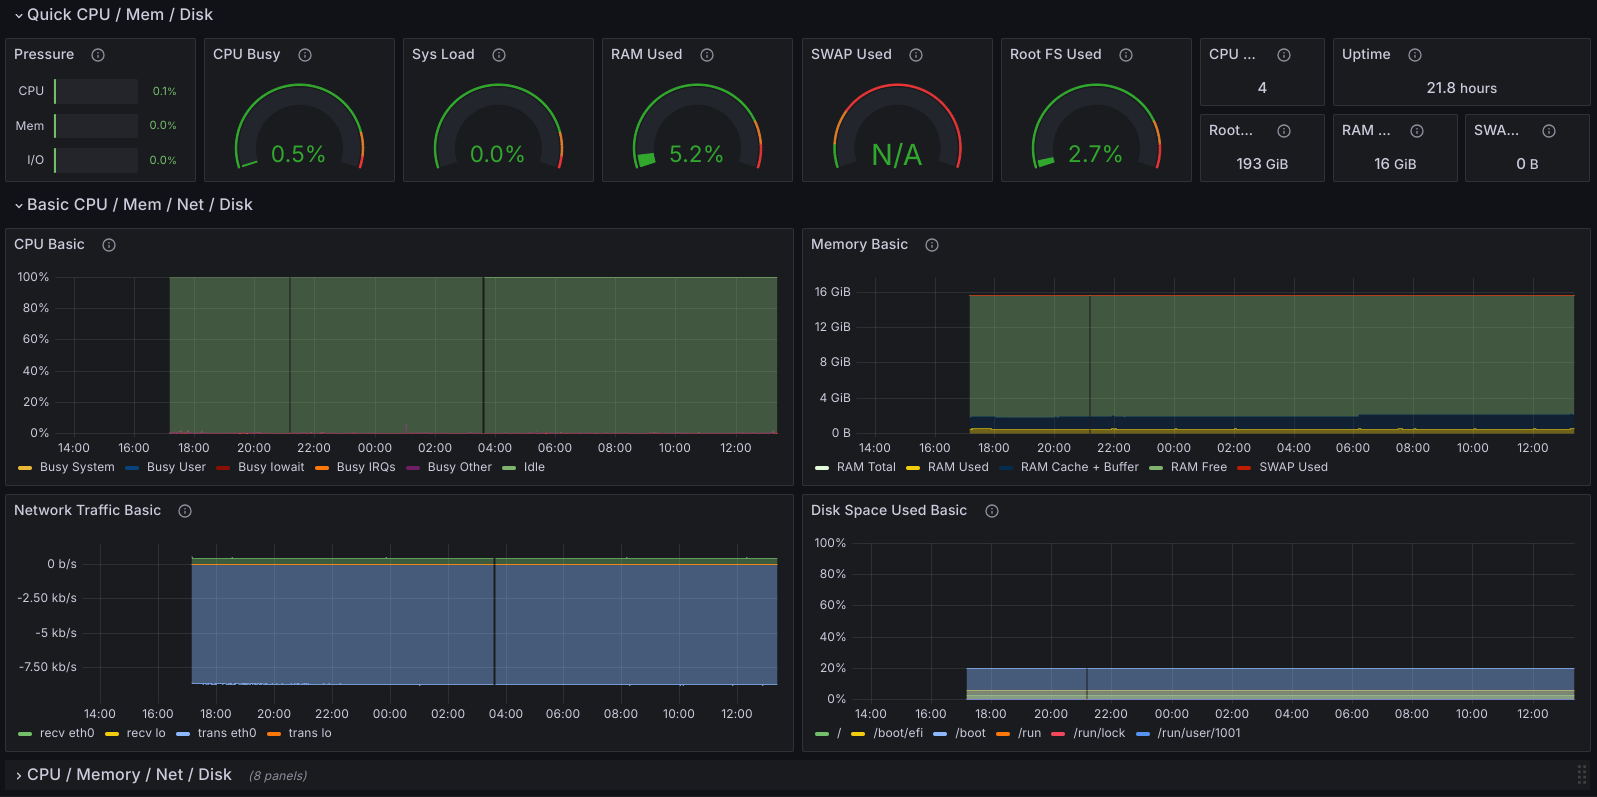
If you would like to monitor statistics like CPU usage on your host machine you can use Node Exporter which is a Prometheus exporter for hardware and OS metrics exposed by *nix kernels.
For standard services you can find pre-built dashboards on Grafana’s website. You can also create your own dashboards which is the ultimate goal but don’t get intimidated by the process. Start with a single panel focusing on a single metric and expand from there.